Practicing network analysis with the Dark family tree

I recently started learning how to analyze and visualize networks in R. Unfortunately, the tutorial course I followed to learn about them wasn’t very helpful to explain the concepts and network parameters through practical examples, it only focused on random nodes connected to each other. Therefore, I decided to practice the concepts I learned with something I think can be visualized with a network plot, and that is, the Dark family tree. Oh yes!
ATTENTION: THERE WILL BE SPOILERS AHEAD
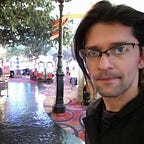
Network plot of the Dark family tree
You may think that a family tree is easy to visualize. It should be just a bunch of people getting married and having babies, right? Well, that is not the case in Dark, a science fiction series that tells the stories of 4 families living in the town of Winden through more than a century. All of them seem to have ordinary lives until one day, Michael Kahnwald commits suicide, leaving 16 years old Jonas Kahnwald without a father. Sometime later, 11 years old Mikkel Nielsen disappears without a trace, and Jonas receives a letter left by Michael. The revelation in that letter is that somehow, Mikkel Nielsen travelled back in time and settled for a new life under the name of Michael Kahnwald. This makes young Mikkel the father of Jonas! And, to complicate things further, Martha Nielsen, the love interest of Jonas is therefore his aunt.
Since Mikkel is not the only character who travelled in time and had babies, the family tree of people in Winden becomes very complicated and full of paradoxes. Explaining each of the family connections would be too complicated, therefore, I prefer to show them to you with a directed network plot, where the arrows point to the son or daughter of a particular character, as shown in Fig. 1. However, some rules apply for this plot, which are:
· Only members of the 4 main families are included, these are, the Nielsen, the Tiedemann, the Doppler, and the Kahnwald.
· The last names of the characters are assigned according to the most common last name used by the character through the series. For example, Hannah became a Kahnwald when she married Michael Kahnwald, who in reality was Mikkel Nielsen after his adoption by Ines Kahnwald. This makes Jonas a Kahnwald despite his parents are originally Mikkel Nielsen and Hannah Krüger.
· The arrows point exclusively to direct sons and daughters. That’s why Ines is not connected to Mikkel (or Michael). Another example is that at some point, Greta Doppler implies that her husband Bernd Doppler is not the real father of his son Helge Doppler, therefore, there is no arrow between Bernd and Helge despite they lived as father and son. Instead, Bernd Doppler had an affair with Claudia Tiedemann, and that’s how Regina Tiedemann was born.
· Some characters have to change their identity through the course of the series due to different reasons. Once again, their last names are assigned as we met them in the series, for example, Boris Newald, changed his name to Aleksander Köhler due to problems with the law, and later became Aleksander Tiedemann when he married Regina Tiedemann (who we eventually know is daughter of Bernd Doppler).
· Noah doesn’t have a last name in this plot, since he was a mysterious character through most of the series.
· Charlotte and Elisabeth are a special case here. They are the only characters with a double end arrow, since Charlotte’s daughter is Elisabeth, and Elisabeth’s daughter is Charlotte. This is possible according to the way time travel works in the series.

Network analysis
Now that the network is established, let’s practice some network analysis and see what can be interpreted from it. I may be wrong about some of my interpretations because I’m new to the topic, in which case, feel free to comment if you want.
· Nodes or vertices: There are 29 in total. Each one of them represents a character.
· Edges or connections: There are 37 in total. Each one of them represents a mother/father to daughter/son relation. Here, the arrow points to the newborn character.
· Farthest vertices: There is a continuous path from Egon Tiedemann (and Doris as well) to the character known as Origin. That path stops there instead of continuing to Tronte Nielsen to prevent an infinite loop. When I evaluated the farthest vertices, I was amazed to see how Egon Tiedemann (one of my favorite characters in the series) eventually became the earliest traceable ancestor to most of the characters in the whole series despite he never travelled in time. This happened because Bartosz Tiedemann, his great grandson, travelled all the way back in time from 2020 to 1888, eventually founding a whole new family. Anyway, it looks like Egon and Doris are at the top of the family tree. That’s something huge considering the existence of other characters in the series such as Jonas and Martha who eventually adopted the nicknames of Adam and Eve, and later had a son referred as the Origin.
· Vertex degree: This represents the number of connections in (in-degree) or out (out-degree) in a vertex. Here, I am counting all, and that is the reason why Elisabeth has a degree of 3, since she is connected to Peter with a single arrow, and then to Charlotte with a double arrow. Anyway, the character with the highest degree is Ulrich Nielsen, since the plot includes his mother Jana, his father Tronte, his daughter Martha, and his sons Magnus and Mikkel.

· Betweenness: This is an index of how frequently the vertex lies on shortest paths between any two vertices in the network. This means that Individuals with high betweenness are key bridges between different parts of a network. Surprisingly, this makes Tronte Nielsen a key vertex of the network. With that in mind, I would expect Tronte to be the man who knows most of the secrets in Winden. However, although Tronte had a share of secret information, he never really understood the origin, the consequences, nor the purpose of it. Actually, Tronte was absent for most of the series.

· Eigenvector centrality: Individuals with high eigenvector centrality are those that are highly connected to other highly connected individuals. Here, the highest eigenvector centrality goes to Ulrich Nielsen. This is more convincing than the previous case, since Ulrich managed to discover the connections between many mysteries in Winden, their habitants, and time travel. He was also one of the first characters to travel back in time and, unlike most of the others, he did it without the help of anybody else. No wonder why he was a detective. I’m sure Ulrich would have discovered even more mysteries in Winden if it wasn’t because of the tragic fate he eventually faced.

· Edge density: This is one of my favorite parameters, which represents the ratio of the edges in the network and the number of possible edges. Here, there are 37 edges, and there are 29 vertices, which give a total of, (29 chose 2) = 29! / (2! (29–2)!) = 406. However, since this is a directed plot, edges can go in and out, which makes a total of 812 possible edges. Therefore, the edge density is equal to 37/812.
· Reciprocity: This is the ratio of edges that are symmetrical and the total edges in the network. That is, 2/37 because only Charlotte and Elisabeth share an edge in both ways.
There are other network parameters such as triangles, transitivity, and mean distance which I do not include here because they do not seem relevant for this case.
Final thoughts
I hope you had enjoyed this network analysis of the Dark family tree. I suppose family trees are normally not studied as network because connections tend to be in a single direction, unless you consider other family members and distant relatives. Anyway, I wanted to try this analysis for the Dark family tree because of the time travel and family loops involved. I am surprised to find that the calculation of the eigenvector centrality really agrees with the investigation skills and network connections of Ulrich Nielsen in the series. Coincidence?